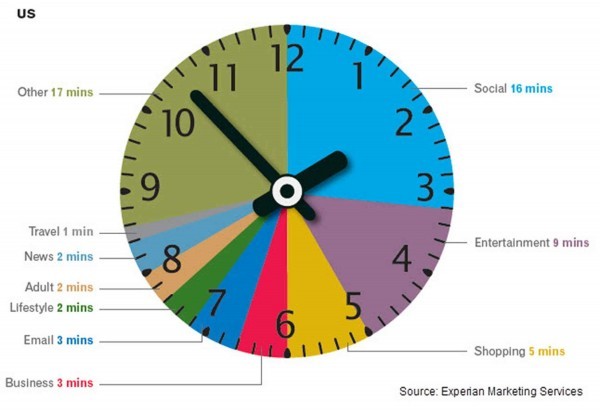
Experian Marketing Services, a global provider of integrated consumer insight, targeting and cross channel marketing, reveals that if the time spent on the Internet for personal computers was distilled into an hour then 27 percent of it would be spent on social networking and forums across US, UK and Australia in 2012. In the US, 16 minutes out of every hour online is spent on social networking and forums, nine minutes on entertainment sites and five minutes shopping.

Global comparison
In the UK 13 minutes out of every hour online is spent on social networking and forums, nine minutes on entertainment sites and six minutes shopping. Australian Internet users spend 14 minutes on social sites, nine on entertainment and four minutes shopping online.
Across all three markets, time spent shopping online grew year-on-year, but the UK market emerged as having the most prolific online shoppers, spending proportionally more time on retail websites than online users in the US or Australia. UK Internet users spent 10 percent of all time online shopping in 2012, compared to nine percent in the US and six percent in Australia. This was in part due to a bumper Christmas season in the UK where 370 million hours were spent shopping online, 24 percent higher than the monthly average.
Consumption of news content also increased across all three markets with Australian users emerging as the most voracious consumers of news online. Six percent of all time spent online in Australia in 2012 was on a news website, compared to five percent in the UK and four percent in the US.
Meanwhile, the time spent on social media proportionate to other online activities declined across all three regions. The US, which has been the most dominant market for social media consumption in the last three years dropped from 30 percent of all time spent online to 27 percent. In Australia time spent on social dropped from 27 percent to 24 percent while in the UK it dipped from 25 percent to 22 percent year-over-year. This highlights the rise in access via 3G and 4G networks as consumers spend increasingly more time online while on the move.
| Average time spent in 2012 by market | ||||||
| UK | US | AU | ||||
| Category | % time 2012 | % time 2011 | % time 2012 | % time 2011 | % time 2012 | % time 2011 |
| Adult | 4% | 4% | 4% | 4% | 4% | 3% |
| Business | 4% | 4% | 5% | 5% | 5% | 5% |
| 3% | 4% | 5% | 6% | 2% | 4% | |
| Entertainment | 15% | 13% | 15% | 16% | 15% | 12% |
| Lifestyle | 4% | 3% | 4% | 4% | 4% | 4% |
| News | 5% | 4% | 4% | 3% | 6% | 5% |
| Shopping | 10% | 9% | 9% | 8% | 6% | 6% |
| Social | 22% | 25% | 27% | 30% | 24% | 27% |
| Travel | 2% | 2% | 1% | 1% | 1% | 1% |
| Other | 31% | 32% | 27% | 23% | 33% | 33% |
| Source: Experian Marketing Services | ||||||
“Understanding consumer behavior across channels is more important than ever as more visits are being made on the move, particularly among social networking and email,” says Bill Tancer, general manager of global research for Experian Marketing Services. “With smart phones and tablets becoming more powerful, our data clearly indicates the difference between mobile and traditional desktop usage further enabling the ‘always on’ consumer mentality. Marketers need to understand these differences, as well as regionally, to ensure campaigns can be tailored for better and more effective engagement.”
Mobile browsing
| Average time spent on US mobile devices – Q1 2013 | ||
| Category | Q1-2013 (h:m:s) | Percentage of time for 1-hour |
| 0:06:24 | 23% | |
| Social Networking | 0:04:05 | 15% |
| Entertainment | 0:03:34 | 13% |
| Shopping | 0:02:59 | 11% |
| Travel | 0:02:33 | 9% |
| Source: Experian Marketing Services | ||
If we analyzed the US browsing data for mobile devices, email accounted for the largest time spent on average, among the same categories for Q1 2013. Email made up 23 percent of time spent on mobile devices for Q1 2013, while social networking accounted for 15 percent. Entertainment had the third highest time spent with 13 percent, followed by shopping with 11 percent and travel with 9 percent. The mobile data does not include app usage, but does include mobile browsing within an app.
Make sure to read about these and more of the latest consumer trends in our 2013 Digital Marketer Report.

